This weekend, I finally had my CPAP Titration Sleep Study! I was diagnosed with severe obstructive sleep apnea (which means I stop breathing at least 30 times an hour while I’m sleeping) way back in May and had to wait over two months to finally get this sleep study done, which will help my doctor figure out the type of CPAP mask I need and the correct oxygen levels for the machine. I went into this sleep study completely blind, as I didn’t really know what to expect or how the night would play out. So I figured I would write it all down here, both for other people’s benefits as well as my own.
I arrived at the sleep clinic a few minutes before my appointment time of 8 p.m. I had to get buzzed in by the sleep technologist who would be monitoring me throughout the night. She was warm and kind, and she immediately put me at ease! I was really worried about the logistics of sleeping with someone watching my every movement (would it be weird or creepy?), but she made me feel a lot better about the situation. Plus, she told me that she would spend most of the night monitoring the data coming from the sensors and such, not so much watching me sleep.
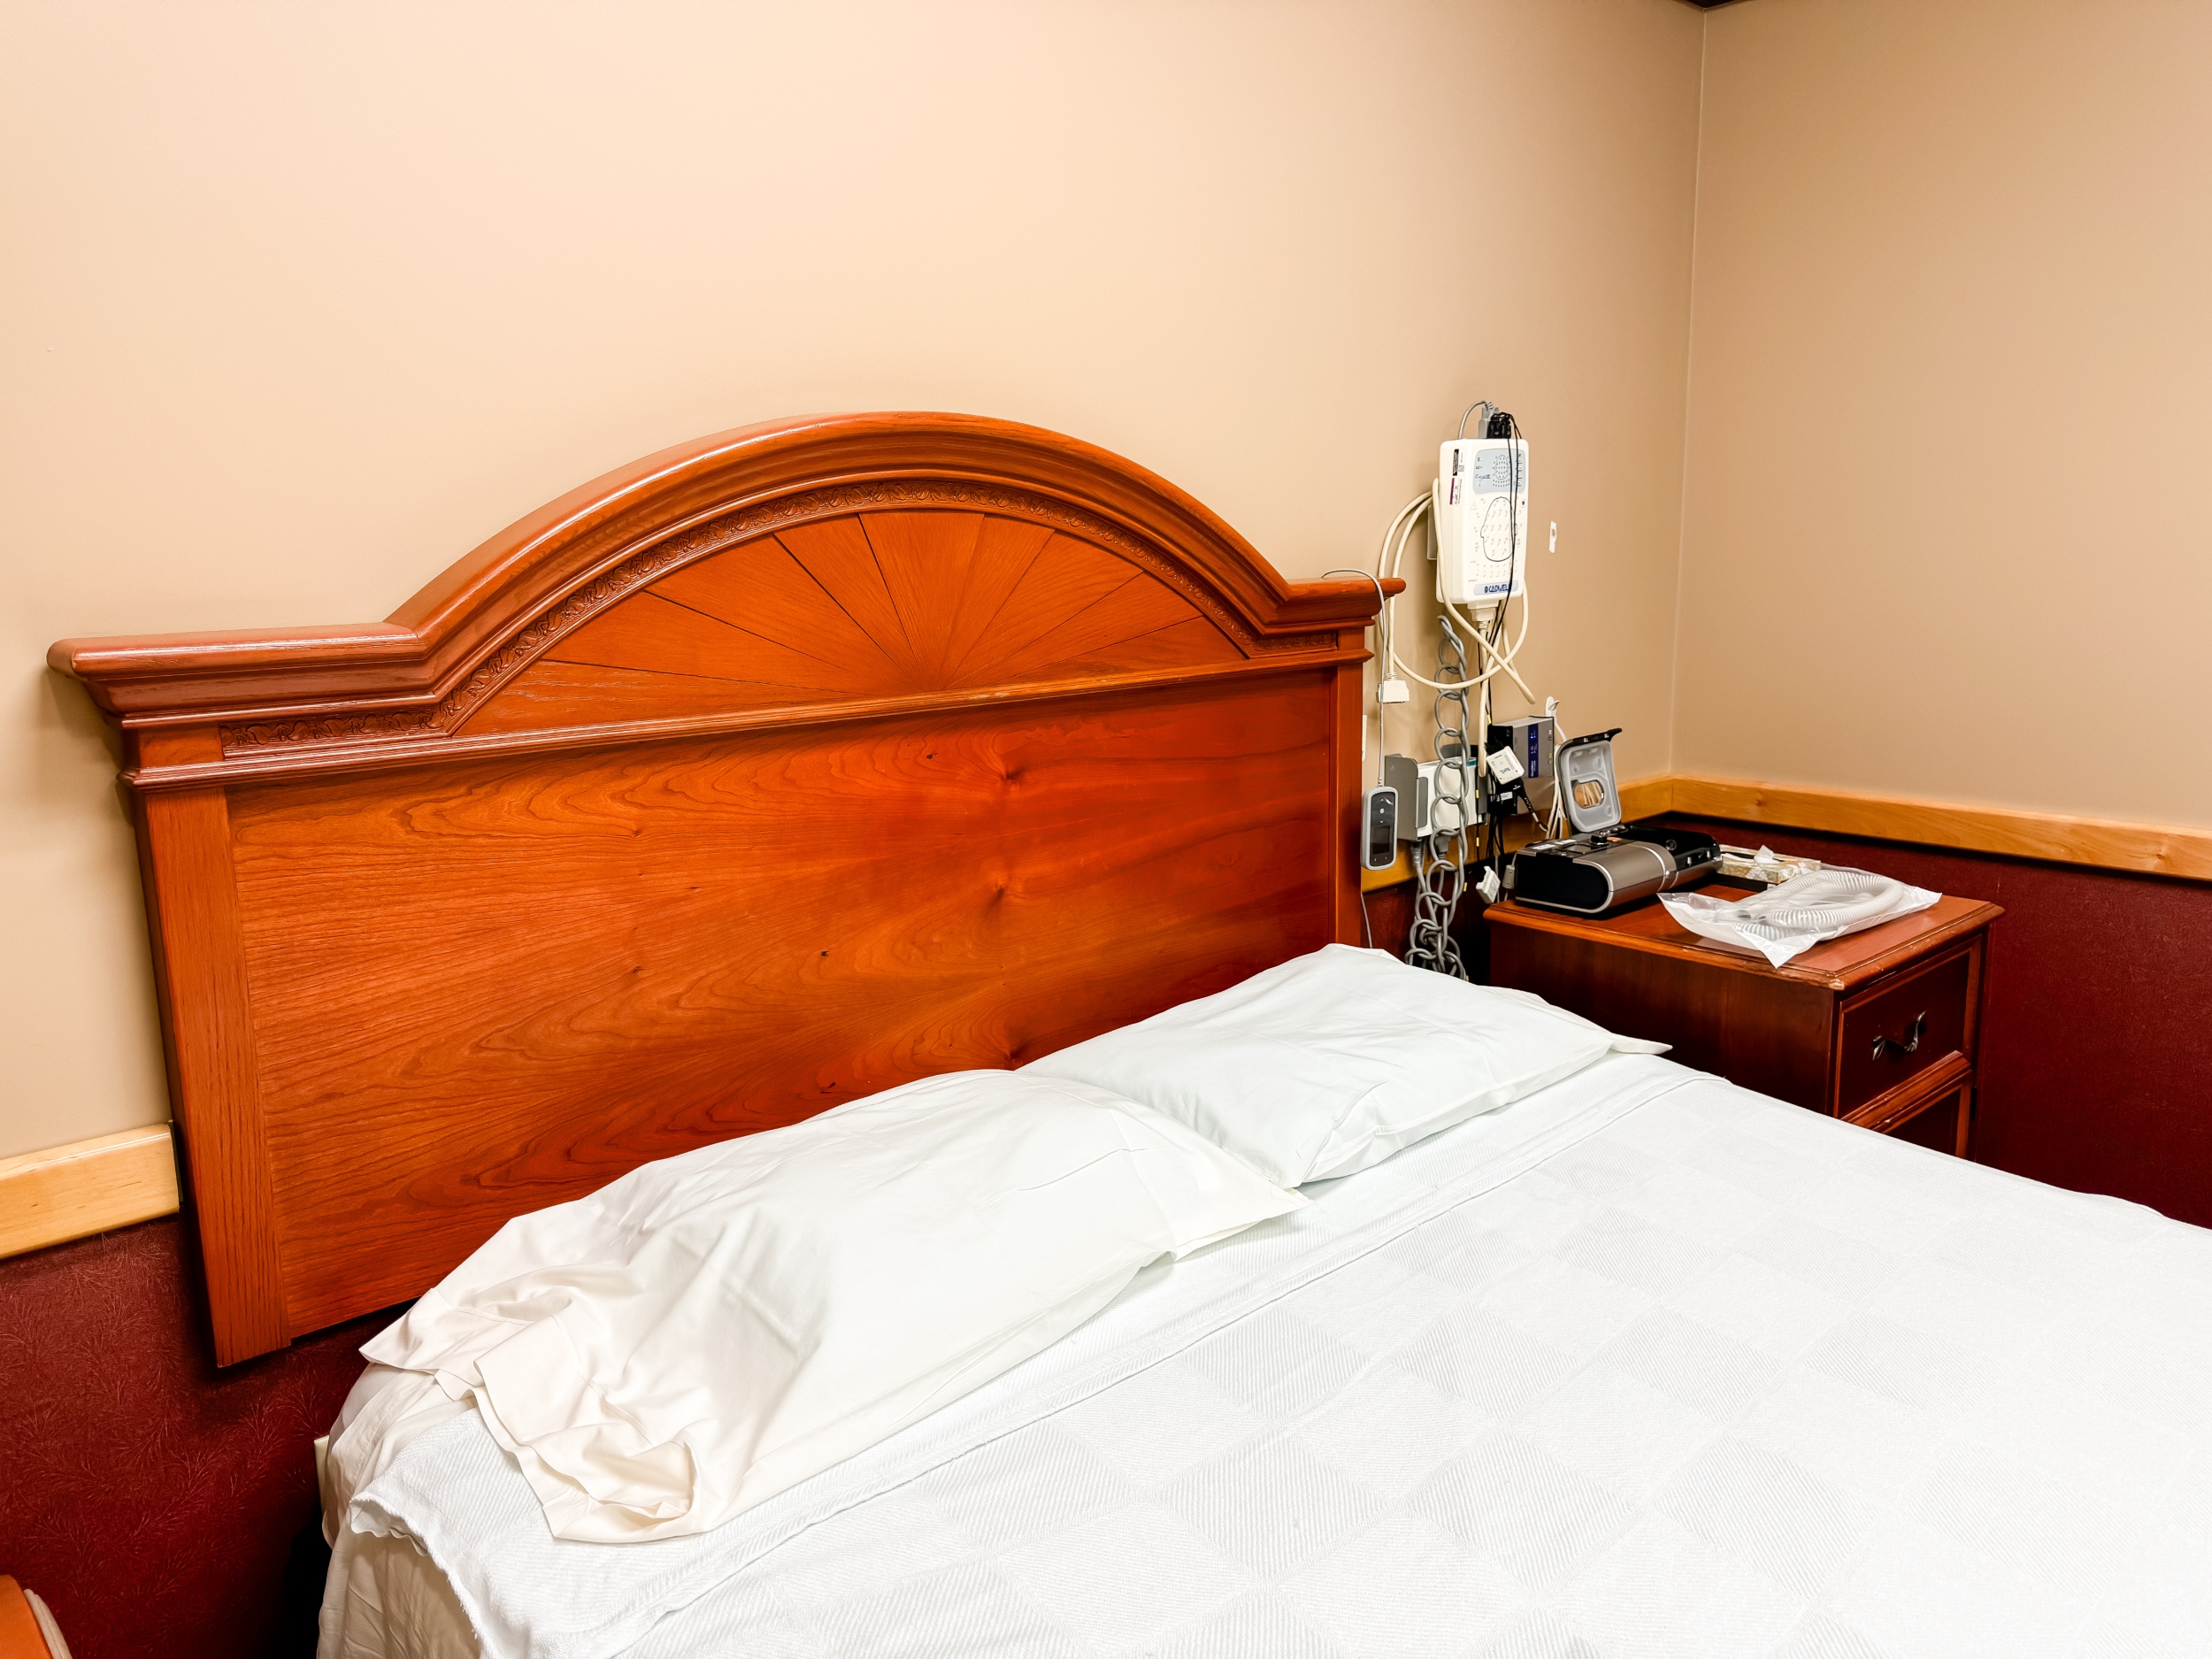
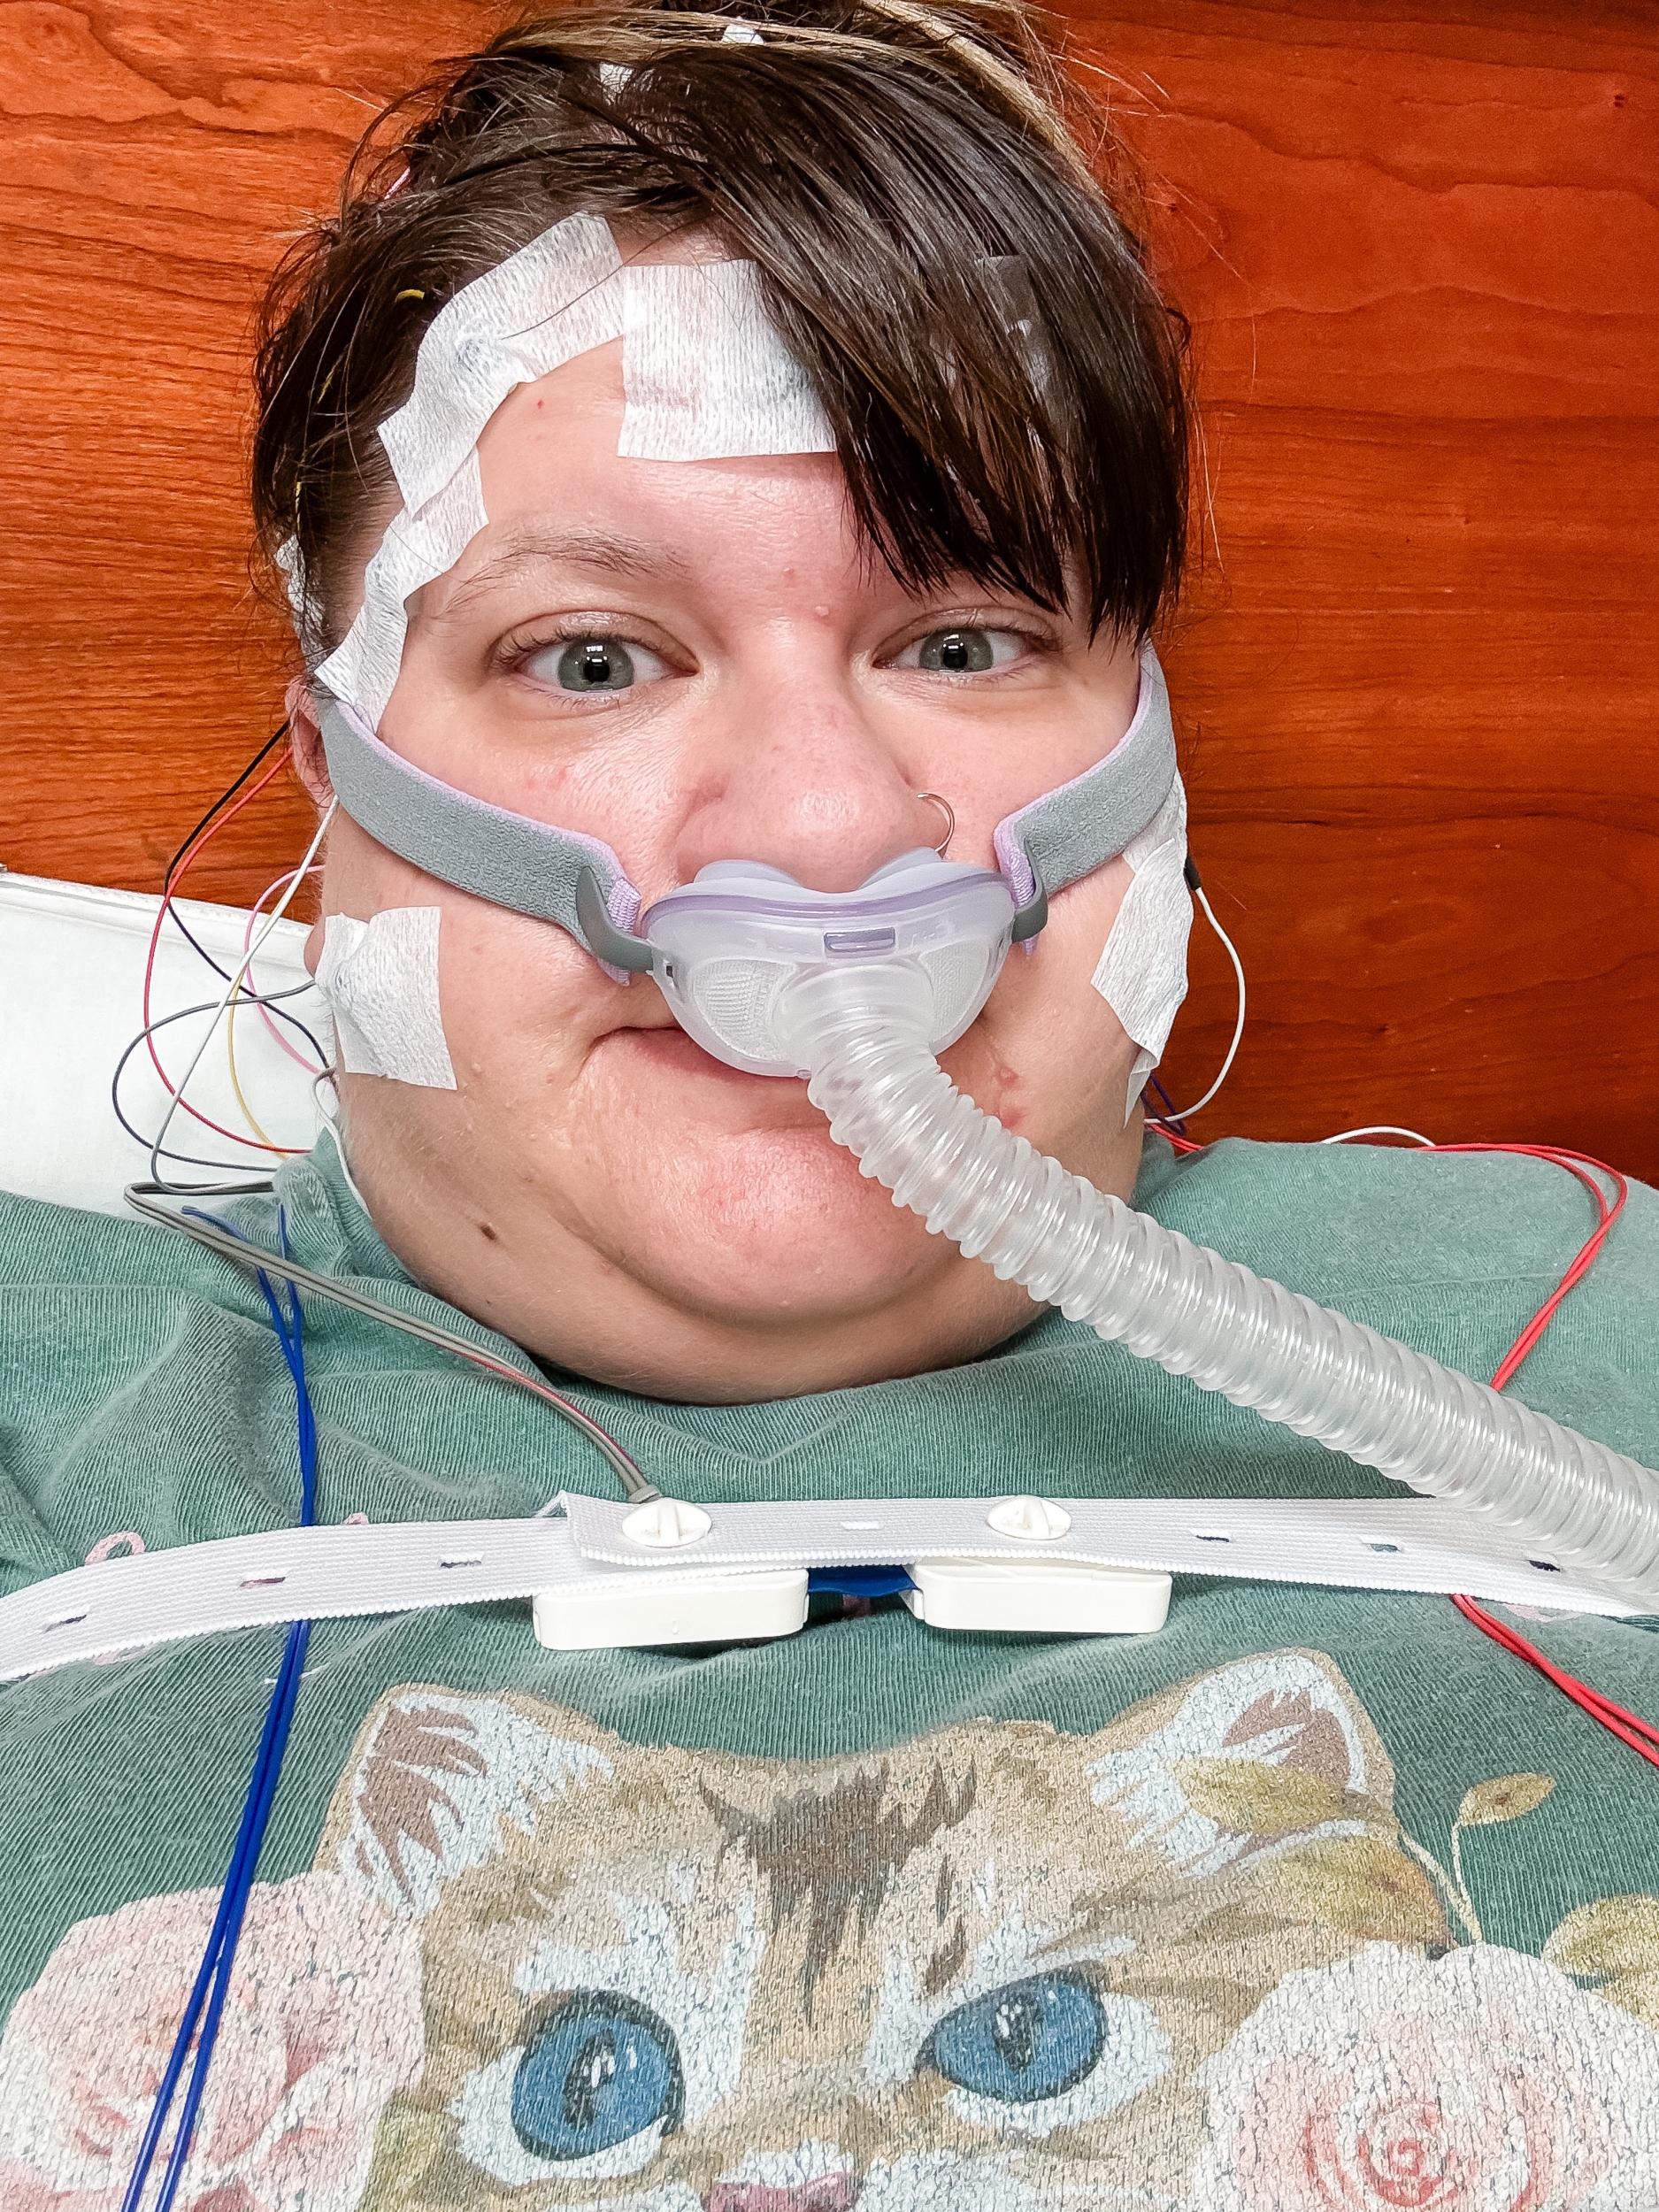
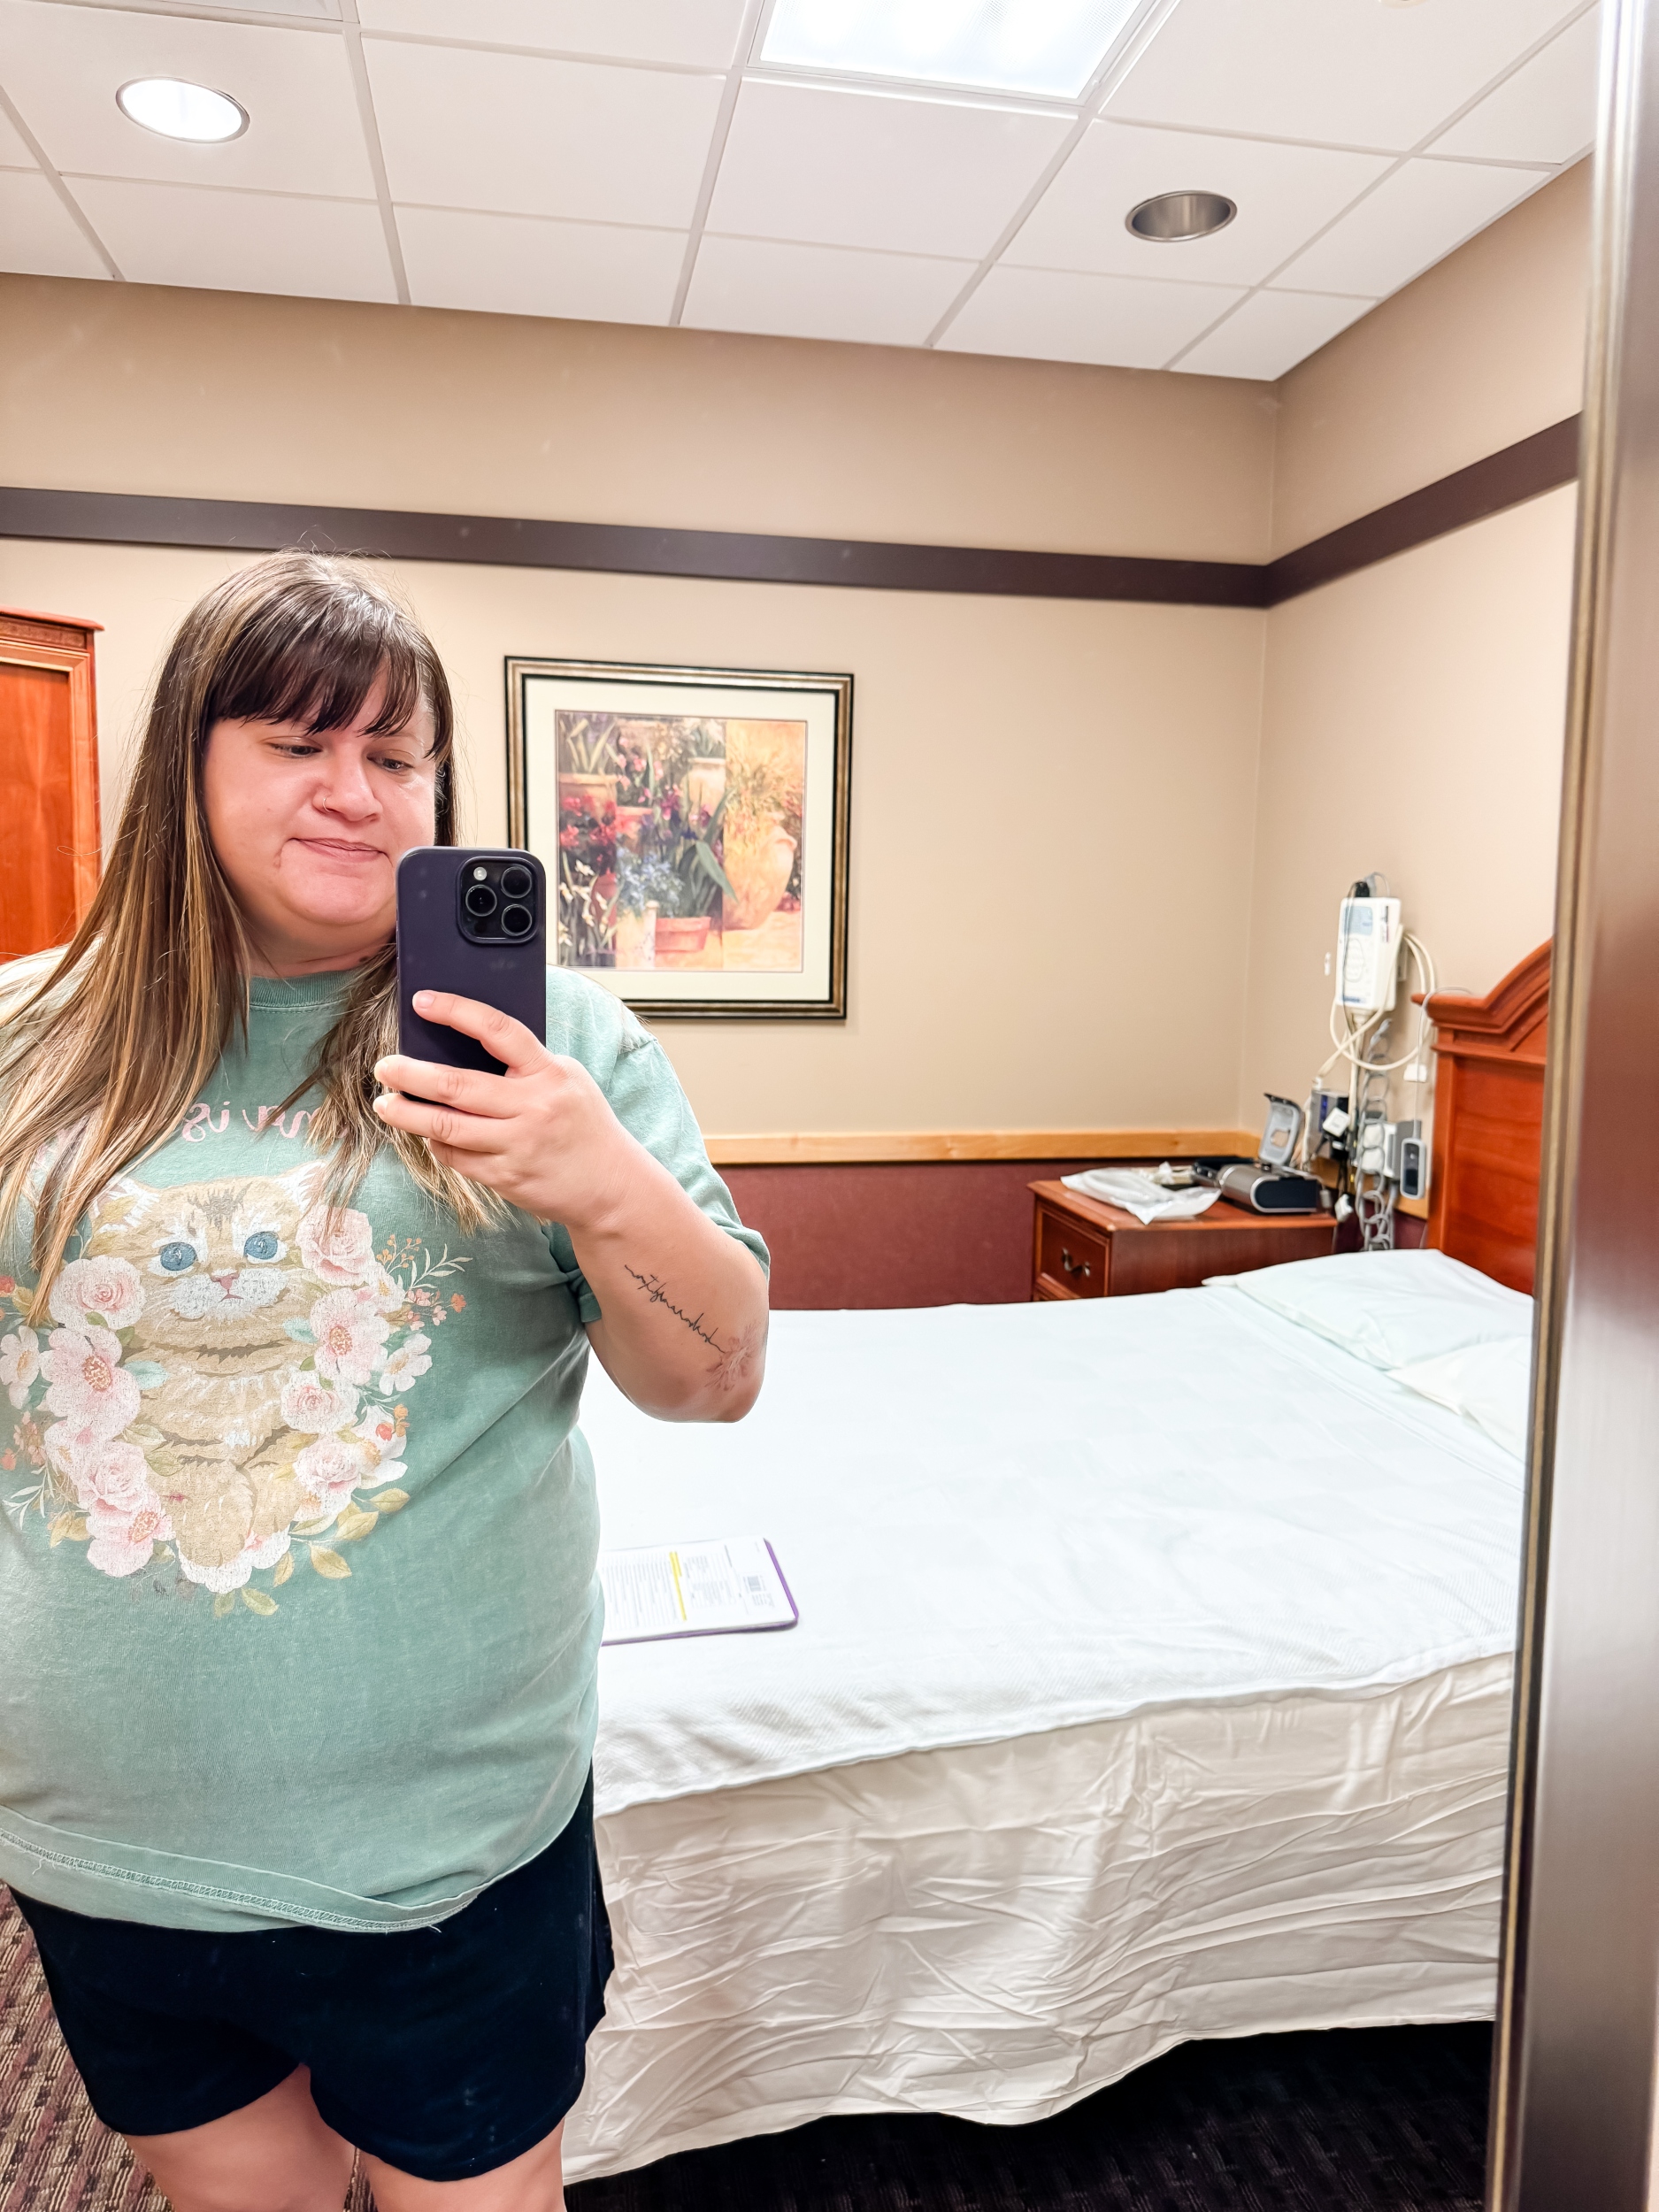
I was taken to the room where I would be staying, which was very bare bones. For some reason, I was expecting something a little nicer? I don’t know why! I even had to use a communal bathroom. The bedroom consisted of a chair, a bed, a bedside table that had all of the CPAP equipment, and a little armoire in the corner. When I arrived, I filled out some paperwork and changed into my pajamas, and then the technologist came in to test one of the CPAP masks on me. It was a nasal mask that was pretty small—it fit right under my nose with two little cushions that were jammed into each nostril to deliver air. Once we figured out the right size for the CPAP mask, the nurse turned on the machine so I could get used to it and she could make sure it was delivering the right amount of oxygen. It was really weird at first! I’m so used to breathing through my nose and exhaling through my mouth, but with a CPAP, you have to keep your mouth closed since it’s delivering continuous oxygen. You have to breathe in and out through your nose. It took some getting used to!
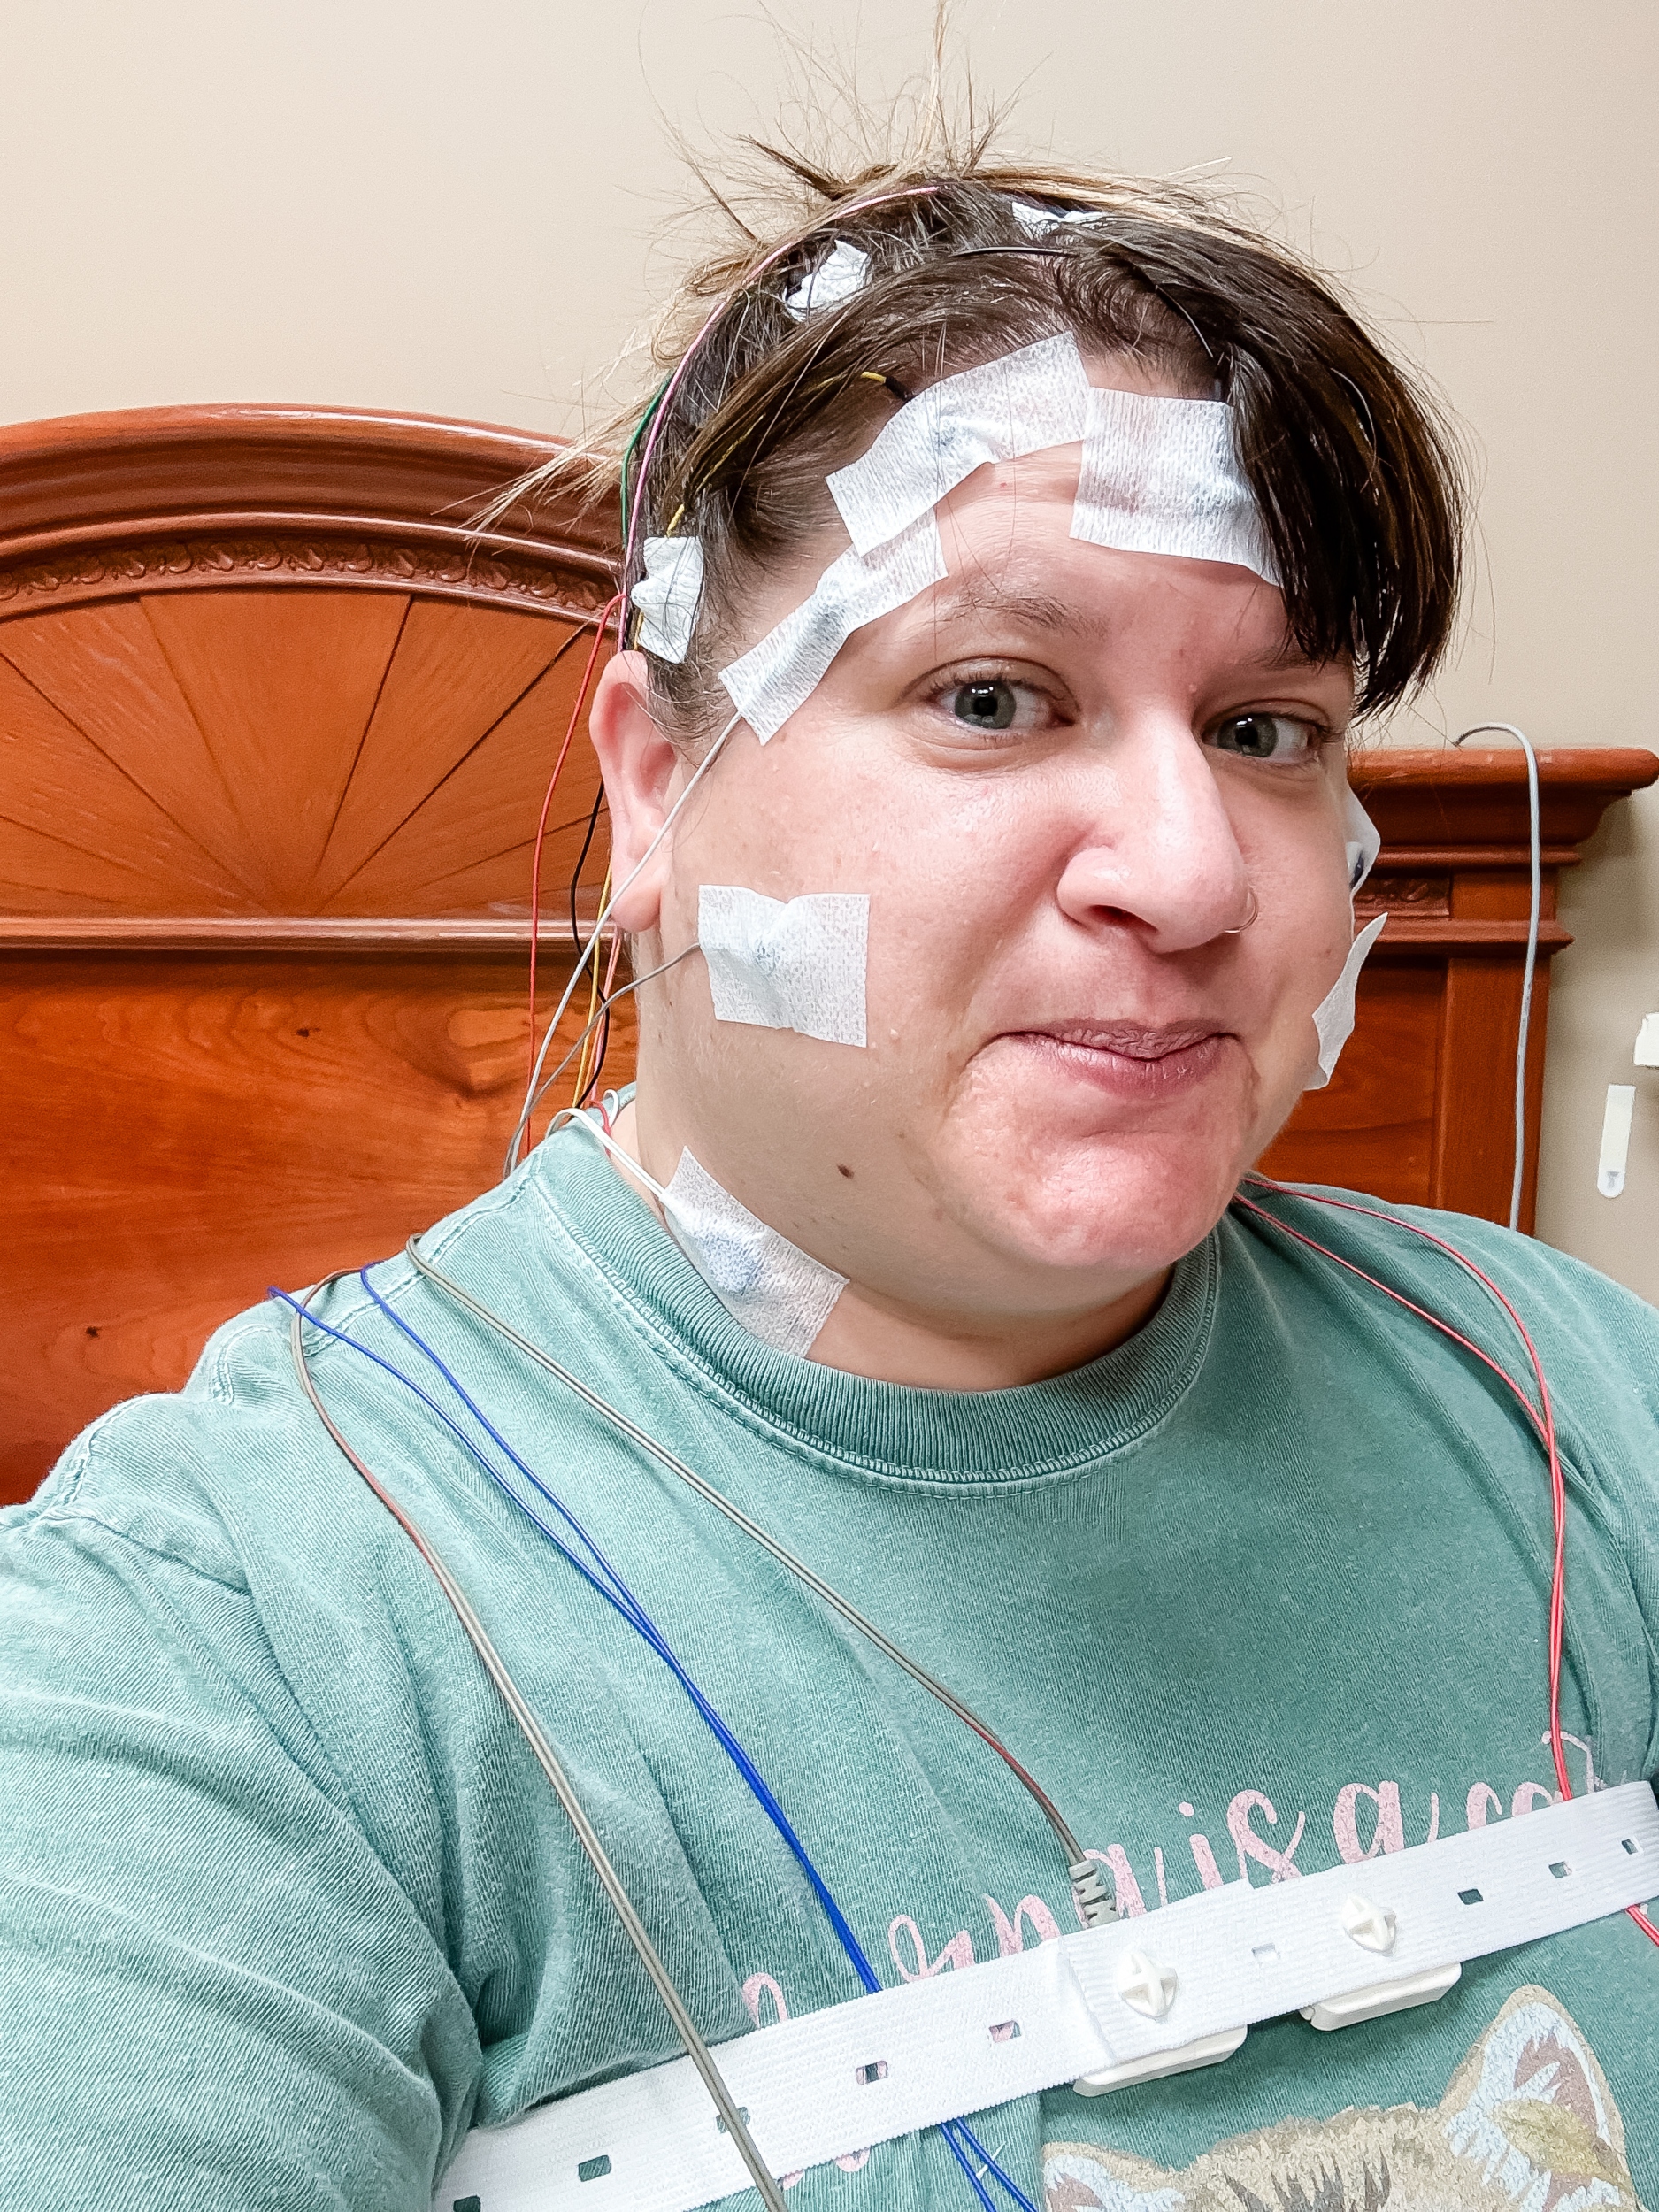
After getting the CPAP adjusted, the technologist removed it so that she could start placing all of the sensors around my body. She had me sit in a chair at the front of the room for this task. And there were a lot of sensors:
- A belt that went over my chest and over my belly
- Two sensors on my legs to monitor leg movement during sleep
- Two sensors placed on my back and two sensors placed on my chest to monitor my heart rate
- One sensor placed on my neck to monitor snoring
- A bajillion sensors placed all around my head—some on my face and some on my scalp to monitor brain and muscle activity
Once all the sensors were placed, the nurse clipped them together behind me and then hooked all of the wires into some sort of contraption. Then, we walked together over to the bed where I laid down as if I was going to sleep so she could hook the contraption onto the bedside table next to me. She wanted to make sure I felt comfortable and that all of the sensors were accurately calibrated. She left the room to check on the sensors at her station and then came back to help me put on the CPAP mask. She also put a pulse oximeter on my middle finger. Once she confirmed that everything was working well with the mask, she told me “good night” and turned off my light!
It was probably right around 9 p.m. at this point and I wasn’t expecting to go to bed so early! I had brought a few books to read and my laptop to keep me busy until I was sleepy. But apparently, that was not the mission here.
I found it really hard to get to sleep. For one, I wasn’t a fan of the pillow situation. I love big fluffy pillows and I want a lot of them. I meant to bring a pillow from home (since that was allowed) but completely forgot. Big mistake! The pillows were super flat and I am not used to sleeping with such little pillow support. And, of course, it was hard to sleep with the CPAP machine and all the wires. The ones on my leg were the most annoying because they got tangled at some point and made it hard to move my legs. (I should have called the sleep technologist to untangle the wires, but I didn’t want to be a bother. HI, I’M AN ENNEAGRAM 9.)
I think I fell asleep for maybe 30-45 minutes at some point and then I woke up because the mask was bothering me a lot. Since the cushions were jammed into my nose and I have a hoop in one of my nostrils, that side of my nose started aching. But the bigger issue was the way the mask was pressing into the area of skin between my nose and upper lip (which Google tells me is called the philtrum, TMYK). It was hurting a lot and I kept trying to draw the skin away from the mask by drawing my upper lip inside my mouth, but that only worked for a little bit. I told myself if I was still awake and dealing with this issue around 11:15, I’d call the technologist. But because she was so wonderful, she came in a little after 11 to ask me if anything was wrong because I’d been awake for quite a while. So I told her about the mask issue.
She removed that mask and gave me a different one to try and I could immediately notice a difference. This one was also a nasal mask but it had a sort of suction-like cup that went over my whole nose, rather than jamming cushions inside my nose. It felt so smooth and nice on my face, and since the hose was connected at the top of the headgear (rather than at the bottom of the mask like the previous one), it also was easier to sleep with. I like this new mask a lot more!
I didn’t get a picture of myself with this CPAP mask, but this is what it looked like.
Eventually, I fell asleep and slept off and on throughout the night. The technologist came in a few times during the night because she was having trouble getting a good blood oxygen level for me. She tried clipping an oximeter to my ear but that didn’t work, so then she gave me a smaller oximeter for my index finger.
At one point, I had to sneeze so I pulled the mask away from my face to sneeze and that caused one part of the headgear to unclip. I was trying to clip it back in myself but was having a hard time and was scared I was going to accidentally mess with the sensors around my head so I called in the technologist.
Around 5:15am, the nurse came into the room to wake me up. My sleep study was done! And then I got the news that she couldn’t ever get a good blood oxygen reading during the night and I may have to do another sleep study. It was really disheartening to hear that because I thought that was the whole point of a CPAP, but apparently, my blood oxygen levels are still low even while on the machine. (My sleep app told me my blood oxygen was at 90% on the night of my sleep study, which is the percentage it’s usually at when I’m not on a CPAP.) So I don’t know what happens next. My doctor will get the results soon and call me about the next steps. I’ve tried googling to figure out why I would still have low blood oxygen while on a CPAP but couldn’t find a conclusive answer.
Anyway, once the nurse woke me up, she removed the mask and then went through the process of removing all of the different sensors. She gave me a washcloth so I could remove any sensor goop from my face. Then, I filled out paperwork to notate how I slept, changed into street clothes, and was out the door by 5:30! The nurse sent me home with the two masks I used at the sleep clinic, but I can’t use them without the machine (well, I mean, I could wear them for shits and giggles but that would be weird), so now I wait to find out what my doctor wants to do next: another sleep study or a specific CPAP therapy that will help my blood oxygen levels? IDK!
This has been a very long post, but I want to end it with some of the things I learned doing an in-clinic sleep study and some of my tips:
- Bring what you need to sleep comfortably. Whether that’s extra pillows, a specific blanket, a noise machine, or cozy socks… you want to be as comfortable as possible so you get a good night’s rest and the sleep technologist can gather as much data as possible.
- You are not going to have lots of downtime, so maybe just bring your Kindle. My sample size is 1 so maybe this is different depending on the sleep clinic or the technologist, but I brought a bunch of things to keep me busy when it was honestly get in, get sensored up, go to sleep, go home. I didn’t even get to read before she turned out the lights, wah!
- The sleep technologist wants you to have a good night’s rest, so if you need a specific temperature to sleep, want a fan on, or extra blankets/pillows, tell them! (In hindsight, I should have asked if I could have had an extra pillow or two, but #enneagram9.)
- This may feel weird to you but it’s a normal workday for the sleep technologist. They aren’t there to watch your every move while you’re sleeping, but rather to keep track of the data coming from your sensors and make any adjustments necessary from there. I thought I would feel weird sleeping while someone monitored me, but it wasn’t at all!
- The day before the sleep study, wake up early, steer clear of caffeine, and do not take a nap. You want to be extra sleepy for this study! It’ll be hard but worth it.
That’s how my CPAP Titration Sleep Study went! Have any further questions for me? I’m happy to answer any and all of them!

